Posts

Null Handling Example in my 'Extending Module – Creating Custom Calculations' video course

Image
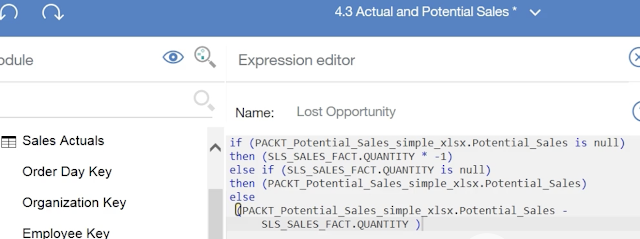
I received feedback on the 'Extending Module – Creating Custom Calculations' video from my ' First Guide to Dashboards using IBM Cognos Analytics (V11) ' video course, that I was too fast in this video and hence some viewers are not able to follow what I am trying to teach in the NULL handling (IF .. ELSE) part.  Hence I am trying to elaborate on this topic in this blog. In this video, we are learning how to create simple mathematical calulcation items using our own (customized) calculation expression.  We are start with simple subtraction of two items namely: Potential Sales and Actual Sales. We are calling it Lost Opportunity .  The expression for Lost Opportunity is: Potential Sales minus Sales Qty. This would work fine when we are values for both the data items. However, there could be certain months, for certain products, where we have 'Potential Sales' data but the Actual Sales Quantity is not present (NULL) and vice versa. It is the standard behaviour of

Cognos Dashboard Course (PACKT): Not able to find GO WAREHOUSE

Image
My of my video course subscribers complained that the 'GO WAREHOUSE' model cannot be found in the IBM Cognos in Cloud.  Please note that I made two video courses in the year of 2017 when Cognos v11 (Cognos Analytics in Cloud) for first launched. That time this model was available. Afterwards (in 2020), it was updated and renamed. So I suggest the following options to the learners: Option 1: Move to the newer video course that I published in the year 2020. In this course, I am providing data files that the learner can upload and use. It does not rely on IBM provided data models. Here are the links for this course: O'Reilly:  https://learning.oreilly.com/videos/first-guide-to/9781800203419 Packt:  https://www.packtpub.com/data/first-guide-to-dashboards-using-ibm-cognos-analytics-v11-1-r5-second-edition-video Udemy:  https://www.udemy.com/course/first-guide-to-dashboards-using-ibm-cognos-analytics/ Option2: If it is not possible to grab above new video course, or if you are on

Now on Udemy too!

Image
Finally, my Cognos Analytics Dashboard Video Course is available on three platforms that I was intending. This provides flexibility to the learners to use the platform of their choice, and avail best pricing and offers. Posting all three links here: O'Reilly:  https://learning.oreilly.com/videos/first-guide-to/9781800203419 Packt:  https://www.packtpub.com/data/first-guide-to-dashboards-using-ibm-cognos-analytics-v11-1-r5-second-edition-video Udemy:  https://www.udemy.com/course/first-guide-to-dashboards-using-ibm-cognos-analytics/ Happy Learning to everyone!

'Members' in Cognos Analytics - Extremely powerful and unique feature

Image
Cognos has always had a very powerful feature called 'Dimensionally Modelled Relational (DMR)' schema. Basically, even if you are not using a pure Dimensional Database (like Transformer Cubes or TM1), Cognos allowed modelling Dimensions, Hierarchies, Levels, etc on top of the Relational Data sources. This way it allowed the Report Authors to drag only a specific element from the dimension rather than dragging the whole column and then filtering for values. It also allowed using the Dimension functions like Children(), Siblings() etc. This feature is also available out of box when using Cognos Analytics. In Cognos Analytics, when you create a Data Module, and specify a data item (column) as Identifier or Attribute, you can enable the 'Members' property. When you do that, Cognos will find the Unique Members or Elements from the column and show them in the tree. These 'members' can be then independently dragged on the rows or columns, essentially creating a filtere

Free Powerful Data Analysis and Visualization Tool

Image
I am pleasantly surprised that a very powerful tool for data analysis and visualization is now available for free, for personal use. This tool is Microstrategy Desktop. Microstrategy is a leading Dashboarding tool in the space of Relational Data. This free Microstrategy Desktop tool enables users to learn how to connect Microstrategy to various data sources, or feed the data using Excel or CSV files and then build beautiful Dashboards.  So don't wait. Download today. It is available at this link: https://www.microstrategy.com/us/get-started/desktop 

Now on O'Reilly too!

Image
I am excited to present the second edition of video course on Building Stunning Dashboards using IBM Cognos Analytics v11.1 R5. This course is now available on O'Reilly. Luckily many professionals have a corporate account provided by employers for O'Reilly.  So do check out:  https://learning.oreilly.com/videos/first-guide-to/9781800203419

Dashboards using IBM Cognos Analytics v11.1 R5

Image
Excited to present my video course for building stunning dashboards using Cognos Analytics in Cloud (v11.1 R5). Please see the Course Overview and Subscription details here: https://subscription.packtpub.com/video/data/9781800203419 # cognosanalytics hashtag # ibm hashtag # data hashtag # businessintelligence

Add Slider or Content Filter to Workspace

Image
If you want Cognos® Workspace users to filter content in a workspace based on a data item that is not visible in the report, you must include this data item in its own query and name it  _BusinessInsight_  within the IBM Cognos Report Studio report. Therefore, the data item must exist in both the query used for the data container (such as the list, crosstab, or chart) and in this separate query. For example, a chart shows the revenue for the product lines for each region. You want to filter the chart to show only data for the year 2008. When you author the report, in addition to including Year in the Query1 used for the chart data container, you create a new query named  _BusinessInsight_  that includes Year.

Tracing user activities across AUDIT, IIS and Cognos Logs

Image
Some times for stubborn intermittent problems like users complaining 'random' slow down of reports or errors without any description, you want to investigate multiple layers. You can start with following: 1.        Enable Cognos Auditing and check COGPIF_USERLOGON with COGPIF_ACTION to understand what operations were exactly going on during the time of error/slow down. 2.        Tally that with IIS Logs. In case of multi-server deployment, Audit gives you the IP Address of application server that handled the request. If there are any network related issues, IIS might have more information. If IIS logs have no corresponding entries, you know that client (Analysis Studio, Workspace Advanced, etc) is not even hitting the server. 3.        If IIS logs show corresponding entries, POST and GET operation and no network related errors, then check for Cognos logs (cogserver.log)

IBM Solves problem between Cognos BI and TM1 Rules in Version 10.1.1

Image
Our database development team shared a great news that I must post here. In my previous post, I mentioned about how Cognos BI (Report Studio and Analysis Studio) stop showing numbers for aggregated levels as soon as any rule is added to the TM1 cube. Well, as per the documentation from IBM, the latest version of TM1 (v10.1.1) solves this problem. Please see below from the IBM documentation: Rule-aware aggregation in Cognos TM1 and Cognos BI IBM Cognos TM1  now allows the aggregation computation to take into account  Cognos TM1  cube rule definition so that Aggregate computations are now aware of  Cognos TM1  cube rules. In previous versions of  Cognos TM1  the default aggregation could not be computed by the Cognos Business Intelligence (BI) server when applied to  Cognos TM1  rule-calculated cells. With rule-aware aggregation in place, the aggregation numbers are reported based on the semantics of the  Cognos TM1  rules. We haven't yet tested this feature but we a

Cognos 8.4 and TM1 9.5

Image
I have been meaning to write about my experiences and learning of writing Cognos Reports (version 8.4) over TM1 cube since long. Finally got around doing it today. In coming days, I will keep on adding new points that I learn and are worth mentioning. The most irritating and strange behaviour we saw during this development is – many standard OLAP reporting features of Cognos stop working after you put rules in the TM1 cube. These features are: 1. Automatic Aggregation: All the measure with aggregation set to automatic stop working and you have to define the aggregation function. i.e. Total in most cases. 2. Slicer and Row Member sharing: Often you put many slicers in query each based on a prompt. So you might have slicers on Dates, Products, Location, Currency, Scaling, etc. These will be standard in all reports with standard prompts and irrespective of what dimensions you have in crosstab report. However, after putting rules in TM1 cube, if we have a dimension in rows or columns (sa

IBM Cognos TM1 Cookbook book and eBook by Ankit Garg

Image
Congratulation to Ankit Garg on publication of his book on Cognos TM1! Another addition to PACKT's cookbook series with this great contribution by Ankit Garg to the world of BI. Please do check out this book today. . A comprehensive developer’s guide for planning, building, and managing practical applications with IBM TM1 . No prior knowledge of TM1 expected . Complete coverage of all the important aspects of IBM TM1 in carefully planned step-by-step practical demos . Practical recipes that illustrate the use of various TM1 features http://www.packtpub.com/ibm-cognos-tm1-for-planning-budgeting-forecasting-solutions-cookbook/book

Copying multiple Report Studio reports into one

Image
Some times we create seperate reports but later on require to copy them all into one to make a report pack. Though Report Studio is very good in allowing us copy paste individual objects across, you need to be very cautious otherwise you will end up spending hours in fixing errors. In my understanding, if you follow below steps, you will be fine. 1. Open the first report in studio that you would like to copy in the pack. 2. First of copy all required Query Subjects across to destination by going in query explorer. 3. Then copy the conditional variables across to destination report. 4. Now we need to copy the Conditional Styles across but unfortunately it is not direct copy-paste operation. Hence, you will need to open both source and destination reports' XML specification in an editor. Then locate the Conditional Style tags from source report (they are usually towards the end of specification) and copy them to destination reports. 5. Now bring the modified specification back in re